Sign up for Your Local Epidemiologist New York and get Dr. Marisa Donnelly’s community public health forecast in your inbox a day early.
Disclosure: At my day job, I am an epidemiologist at Biobot Analytics, a wastewater company. While we don’t have wastewater sites in New York City, we work with several New York counties.
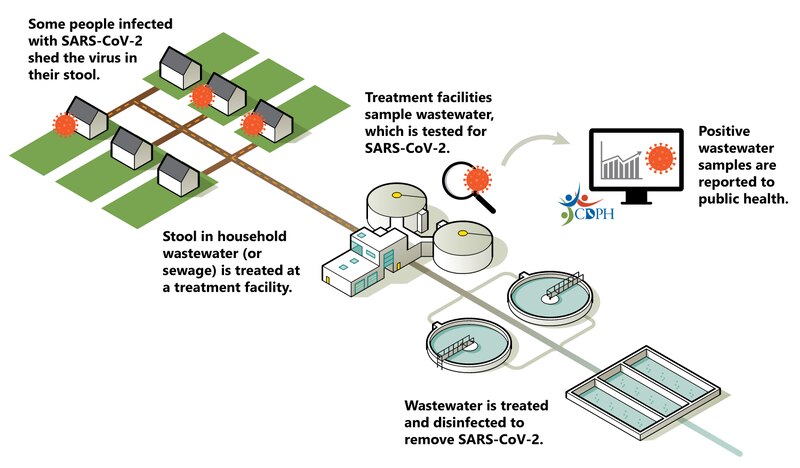
Ever wonder what is streaming in the sewers below the New York streets? Our wastewater system provides more than just sanitation. It can also act as an unbiased surveillance system (an epidemiologist’s dream).

This approach grew in popularity during the COVID-19 emergency and delivers an insightful, near-real-time view of our community’s health. Turns out, the best way to understand what’s going around — and what we can do to keep healthy — is by watching what’s going down — literally.
We New Yorkers don’t just have any old system, though. We have one of the strongest state-level systems in the United States. In August, the New York State Wastewater Surveillance Network was named a CDC Center of Excellence.
What is the NY state wastewater system?
Wastewater surveillance began only three years ago in New York during the Covid-19 emergency. Wastewater detected increases in virus activity before other data sources, like hospitalization records, making it an incredibly useful tool for early warning. Everyone uses the toilet, so wastewater can give a picture of the entire community (when connected to sewers) instead of relying on individuals getting swabbed and tested.
How it works: Sewage samples are collected from multiple sites and sent to labs for testing. The data is then analyzed to detect the spread of pathogens within communities. This process is the same across the United States.

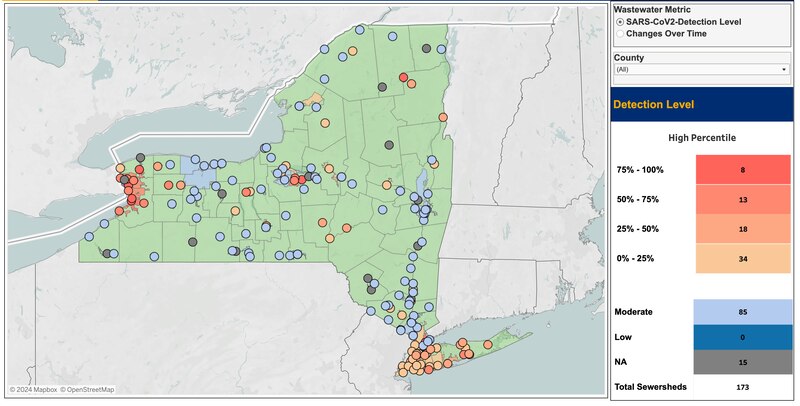
One big difference between states, though, is coverage. Our state has over 200 wastewater surveillance sites, covering more than 75% of the New York population — one of the highest coverages in the United States.
For Covid-19 alone, New York can track levels across 60 counties, including all five counties in New York City.
One big reason the New York wastewater network is so strong is funding from the state and Centers for Disease Control and Prevention. Last year, Gov. Kathy Hochul added it to the fiscal budget: $5 million per year for three years (starting in 2023), totaling $15 million. New York is one of the only states with a state-line budget item for wastewater surveillance.
You have two places to see data (and thus take action)
Checking wastewater trends can help with personal decision-making, like wearing a mask when Covid-19 levels are high.
First, you can go to the state website. Covid-19 data, for example, is available on this public dashboard. I’ll also keep you updated once fall respiratory season kicks off.

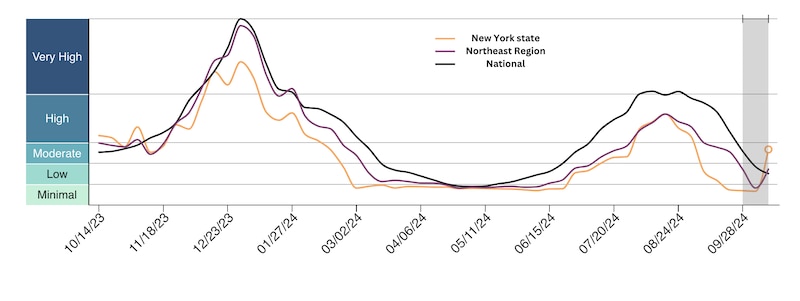
There is also the CDC National Wastewater Surveillance System dashboard, where average wastewater activity levels for New York state and individual sites are available.
There may be differences between the two dashboards, though. This can happen for three main reasons:
- Local differences. Some communities have more or less Covid-19 activity than the statewide average, leading to differences between local levels and state averages.
- Levels are defined differently. New York’s wastewater levels are based on early pandemic data (2020-21), while the CDC recalibrates its levels every six months, making them more adaptive to current trends, such as increased viral shedding from new variants.
- Delays in reporting. Averages will fluctuate depending on how many sites are contributing data and if there are delays in reporting.
For example, the most recent New York data on CDC NWSS shows an apparent increase from recent minimal levels to moderate this week. However, the New York data sent to NWSS is delayed this week, with only two sites reporting. In other words, the most recent data displayed is not representative of the entire state. I expect the New York wastewater level on NWSS to go back down once the data is updated.

I like to use the New York dashboard for site-specific trends and the CDC NWSS dashboard for state-level averages and activity. Not every community in New York state has wastewater monitoring, but following the average state levels can often be good enough.
Wastewater system is also useful for polio
In July 2022, after 25 years, the first case of paralytic poliovirus in the state was confirmed in Rockland County, New York. The state public health system quickly adapted its Covid-19 wastewater program to begin tracking polio — after all, the process is the same; the test in the lab is just different.
After taking many samples across the state, wastewater showed that polio was present elsewhere: Sullivan, Orange, and Nassau counties, and New York City. When they tested historical wastewater samples, polio was present in wastewater as early as April 2022, three months before the case was identified. Public health departments prioritized resources — like education and vaccine campaigns — to communities where wastewater showed that polio was circulating.
Center of Excellence Award will allow even more
The quick move to scale the program to track polio likely played a significant role in the program being recognized as a CDC Center of Excellence. This places the New York wastewater system alongside five other CDC Centers of Excellence to continue expanding wastewater monitoring for public health.
This award:
- Recognizes the excellent work thus far, and
- Provides an additional $1 million in funding to support program expansion. New York plans to expand to test for more diseases, including influenza, RSV, hepatitis A, and norovirus, as well as the presence of antimicrobial-resistance genes.
Wastewater must have limitations, right?
Yes, like anything in this world, it’s not perfect:
- It doesn’t cover everyone. Sampling is very difficult in communities that rely on septic systems. The >200 sites in the New York wastewater monitoring program cover about 75% of the state’s population (representing 95% of those connected to sewer systems.) However, the remaining 25% — not currently monitored — are in non-sewered areas, making it difficult to get a hyperlocal perspective on diseases in these areas. (If you’re in these areas, follow the wastewater site closest to you for rough estimates of disease activity.)
- Ethical and privacy concerns. Although wastewater data is anonymized (sampled at pipes that several houses/blocks feed into), concerns could still arise about monitoring. Acknowledging these concerns is important, but a recent national survey found that nearly 75% of adults support wastewater monitoring for infectious diseases.
- Interpretation for epidemiologists is … tough. Wastewater data is great for showing increases or decreases in disease levels. However, it can’t provide the number of people who are sick. When people get sick, the amount of virus they shed is quite variable.
- Non-standardized methods. In New York state (and across the United States), different lab methods are used across counties, making comparisons difficult. In other words, we don’t know if “high” Covid-19 levels in one county are the same as “high” levels in another. New York City uses consistent methods across all sites, allowing for easier comparison within the city.
Bottom line
The wastewater pipelines below our streets provide pivotal information about diseases in New York and how (and when) to protect ourselves. However, this information is not a standalone solution and should be combined with other data sources to provide a holistic view of public health trends.
Love,
Your Local Epidemiologist
P.S. Ever wonder how much waste actually goes into the sewer? On average, individuals will flush the toilet five to seven times daily. With about 8.4 million people, that’s an average of 42 million to 58.8 million toilet flushes daily in New York City. 💩
Dr. Marisa Donnelly, a senior epidemiologist with wastewater monitoring company Biobot Analytics, has worked in applied public health for over a decade, specializing in infectious diseases and emerging public health threats. She holds a PhD in epidemiology and has led multiple outbreak investigations, including at the California Department of Public Health and as an Epidemic Intelligence Service Officer at the Centers for Disease Control and Prevention. Marisa has conducted research in Peru, focusing on dengue and Zika viruses and the mosquitoes that spread them. She is Healthbeat’s contributing epidemiologist for New York in partnership with Your Local Epidemiologist, a Healthbeat supporter. She lives in New York City. Marisa can be reached at mdonnelly@healthbeat.org.


